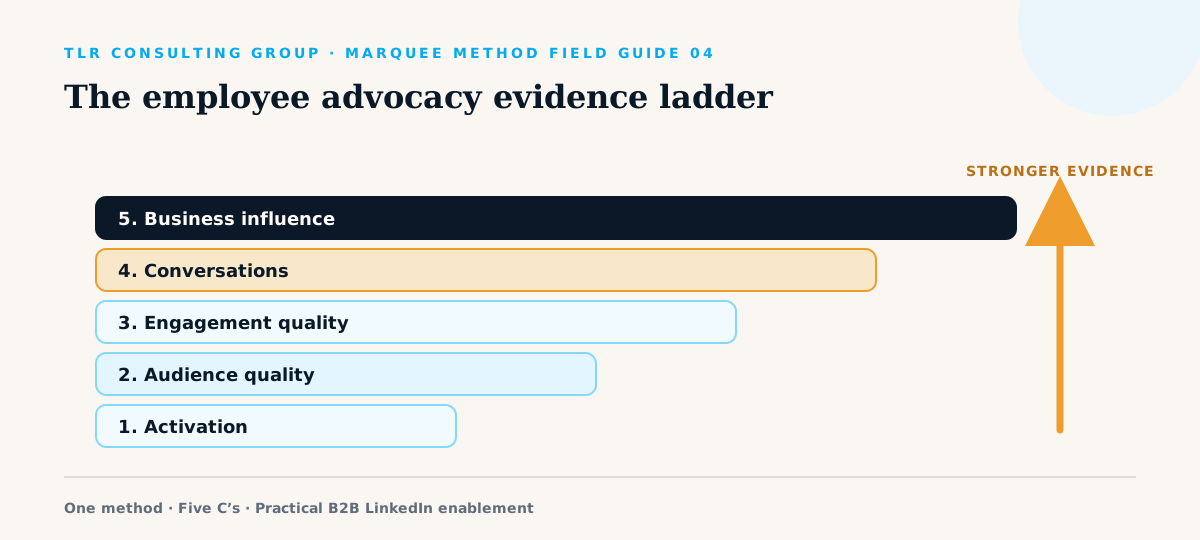
Employee advocacy ROI is rarely one clean dashboard number. It is a chain of evidence: employees adopt the behavior, the right people notice, useful interactions occur, conversations begin, and some of those conversations influence business outcomes.
- Measure the chain, not only its last link.
- Define activation and quality before launch.
- Use CRM and qualitative evidence alongside LinkedIn analytics.
- Report outcomes with honest attribution language.
Use a four-level measurement model
LinkedIn’s own advocacy guidance separates measurement into content engagement, employee activation, and business outcomes. See LinkedIn’s 2026 employee-advocacy analytics guide. For a B2B enablement program, add audience quality between activation and engagement so the team does not optimize for irrelevant reach.
| Level | Question | Example measures |
|---|---|---|
| 1. Activation | Did employees use the system? | Active participants, profile updates, relevant connections, posts, comments |
| 2. Audience | Did the right people see it? | Buyer roles, industries, target accounts, inbound connection quality |
| 3. Response | Did attention become interaction? | Saves, substantive comments, replies, profile visits, introductions |
| 4. Outcome | Did it influence the business? | Meetings, opportunities, hires, partner conversations, retention signals |
Establish the baseline before training
Capture 30–60 days of pre-program data where possible. Record the number of active employees, their current cadence, network relevance, typical audience, meaningful responses, and known LinkedIn-influenced opportunities. Without a baseline, normal variation can look like impact.
Document data limitations. Member analytics can show post performance and audience demographics, but availability varies by account and privacy settings. LinkedIn’s member analytics guide explains the current analytics surfaces. Decide which fields will be collected manually and who owns the monthly snapshot.
Define meaningful engagement
A like from an unrelated peer and a detailed comment from a buying-committee member are not equal. Create a simple weighting model that reflects your strategy. For example: buyer-role save or comment, target-account profile visit, relevant inbound connection, direct reply, and meeting are distinct signal levels.
Do not hide raw numbers; add context. Report “14 substantive interactions from target-account roles” rather than combining them with hundreds of low-intent reactions. Quality measures make a smaller program legible to leadership.
Connect conversations to CRM evidence
Add lightweight fields or tags for LinkedIn-influenced activity: first known touch, relevant post referenced, employee involved, conversation date, next step, and opportunity ID. Ask sellers to log evidence at the moment of handoff instead of reconstructing it at quarter-end.
Use “sourced” only when LinkedIn activity created the opportunity. Use “influenced” when it accelerated familiarity, opened another stakeholder, supported credibility, or revived a conversation. Both are valuable; collapsing them weakens trust.
“The pilot activated 18 of 22 participants, reached 310 people in priority roles, generated 27 recorded business conversations, and influenced six open opportunities.”
Calculate return without false precision
A basic program ROI equation is: (attributable gross profit or value created − program cost) ÷ program cost. But apply it only to outcomes you can reasonably connect. Also report cost avoidance or efficiency separately: reduced paid distribution, faster access to stakeholders, increased candidate flow, or content reuse.
The most credible report includes the metric ladder, the evidence, the limitations, and the next experiment. If your team has not yet defined the behaviors underneath ROI, begin with the employee advocacy operating guide or benchmark the current system with the Visibility Scorecard.
Choose an attribution standard before reporting
Use three labels. “Sourced” means the first documented path into the opportunity came through an employee’s LinkedIn activity. “Influenced” means LinkedIn contributed evidence, access, or conversation after the account was already known. “Correlated” means activity and results moved together without a documented connection.
These labels prevent a common reporting error: assigning the full value of a complex B2B deal to one post. They also protect the program from the opposite error, where meaningful influence disappears because last-touch attribution credits only a form submission.
Build a measurement dictionary
| Measure | Definition | Collection rule |
|---|---|---|
| Activated participant | Completed agreed weekly behavior | Count once per reporting period |
| Relevant reach | Audience matches target roles or accounts | Use available demographic evidence |
| Meaningful conversation | Two-way exchange about a business issue | Exclude reactions and generic praise |
| Opportunity influenced | Documented LinkedIn touch affected access or progress | Require a CRM note |
Document definitions before the first dashboard. Otherwise, each team will count activity differently and the trend line will lose meaning.
Work through a conservative ROI example
Suppose the organization’s fully loaded cost for a 20-person pilot is $35,000, including the engagement fee, employee time, internal program work, and support. During six months, the team documents six qualified meetings influenced by LinkedIn, three opportunities where employee activity clearly improved access, and one closed deal worth $120,000 in gross profit. The report should show the full evidence chain and label the deal as influenced unless LinkedIn created the first documented contact.
A conservative report can present program cost, cost per activated participant, cost per meaningful conversation, influenced pipeline, and confirmed gross profit. It should also disclose the observation period and the limits of attribution. Credibility makes the business case more durable than an inflated headline number.
Use platform metrics as evidence, not proof of revenue
LinkedIn’s 2026 Employee Advocacy Analytics Guide provides audience, adoption, education, and recommendation measures. LinkedIn’s current post analytics documentation includes reach, demographics, profile activity, saves, sends, and link engagement. Those measures describe attention and behavior on LinkedIn. CRM evidence, buyer interviews, and sales notes establish the business connection.
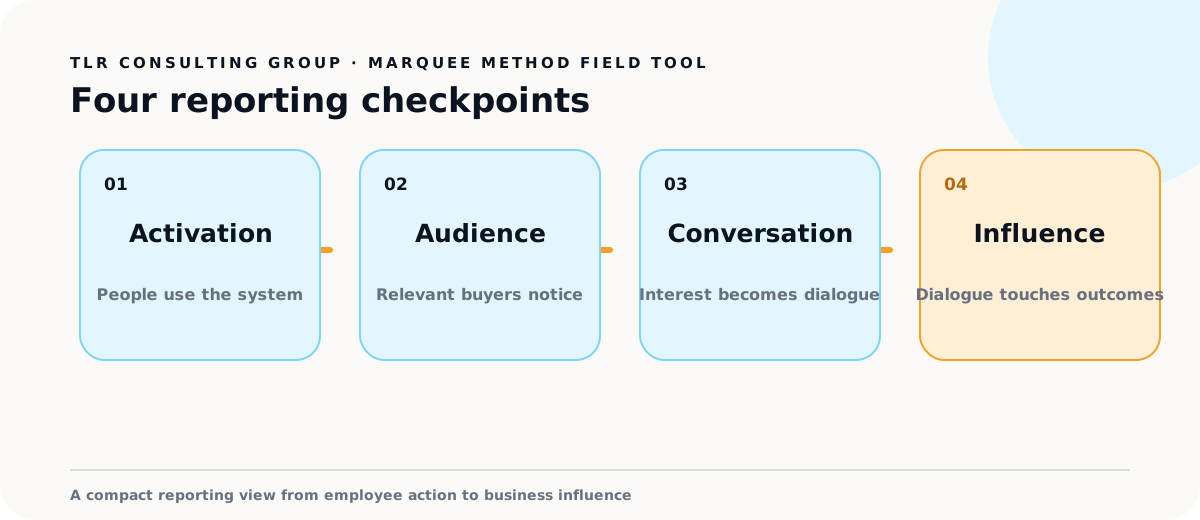
Review the chain monthly and the business outcomes quarterly. A break between activation and audience calls for targeting or content work. A break between audience and conversation calls for stronger relevance or follow-up. A break between conversation and opportunity may belong to the sales process rather than the advocacy program.
Build the quarterly evidence packet
Prepare one page for each link in the evidence chain. The activation page shows cohort size, repeated participation, and skill adoption. The audience page shows target-role evidence. The conversation page includes anonymized examples and source context. The influence page lists sourced, influenced, and correlated outcomes separately.
Add a limitations box. State the observation period, missing data, platform estimates, attribution rules, and changes to the program during the quarter. Show cost assumptions, including employee and program-team time. This gives finance and leadership enough information to challenge the analysis.
Close with one funding decision. Expand, repair, hold, or stop. Name the evidence that would change that decision next quarter.
Frequently asked questions
What is a good employee advocacy ROI?
There is no universal benchmark. Establish your baseline and compare program cost with attributable or influenced commercial value while reporting activation and audience-quality gains.
Can impressions prove employee advocacy ROI?
No. Impressions describe exposure, not whether the right buyers noticed or whether business behavior changed.
How often should advocacy ROI be reported?
Review activation monthly, audience and conversation quality quarterly, and commercial influence on the time horizon of your sales cycle.
Research and method: This guide separates documented platform features and cited research from the operating recommendations used in The Marquee Method. LinkedIn analytics are estimates, research findings describe their stated samples, and platform features can change. Review the linked primary sources before implementing account-specific workflows.
Put it into practice
Benchmark the system before you scale it.
The free Visibility Scorecard compares your company with three competitors and identifies the clearest gaps.
Request the free scorecard