LinkedIn analytics for B2B teams become useful when each metric answers a decision. Impressions can show distribution. Audience demographics can show relevance. Comments and saves can show resonance. Conversations and CRM evidence can show business movement. No single metric tells the whole story.
- Match each metric to a question.
- Separate activity, audience, response, and outcome.
- Compare cohorts and trends, not isolated posts.
- Combine platform data with conversation and CRM evidence.
Start with the decision, not the dashboard
Before collecting data, name the decision it should support. Are you testing whether executives reach priority roles? Whether sellers build relevant networks? Whether employees sustain participation? Whether a content territory creates conversations? Different decisions require different measures.
LinkedIn’s member analytics guide describes member analytics such as individual and combined post performance, audience demographics, profile views, and search appearances, with availability affected by settings and plan. Use what is available consistently and document gaps.
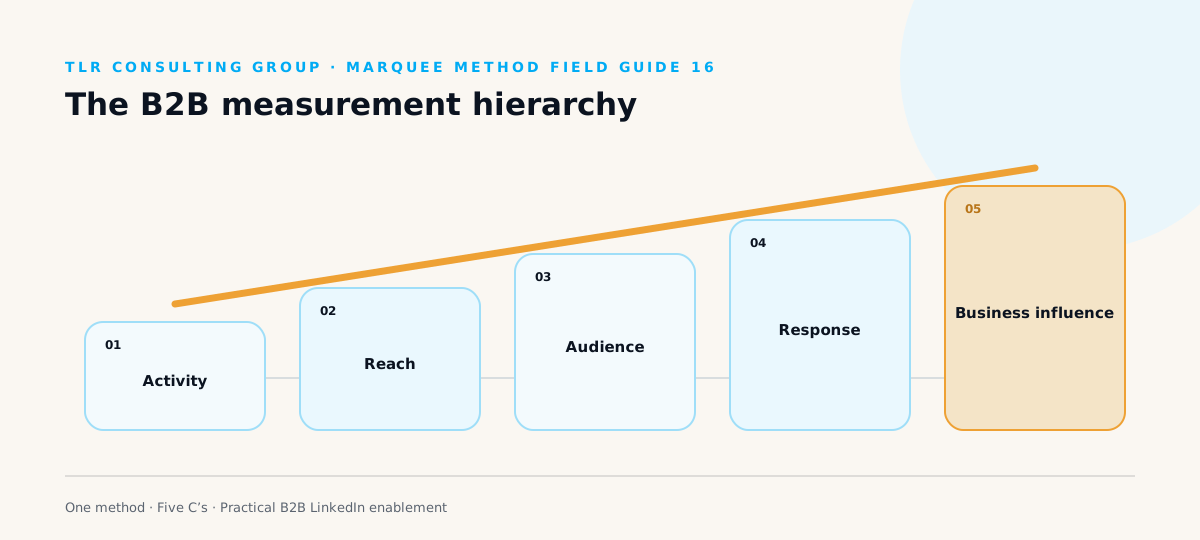
Use a five-level hierarchy
| Level | Measures | Decision supported |
|---|---|---|
| Activity | Participants, posts, comments, connections | Is the behavior happening? |
| Reach | Impressions, members reached, profile appearances | Is distribution expanding? |
| Audience | Roles, industries, seniority, geography | Is it reaching the right people? |
| Response | Saves, substantive comments, replies, inbound connections | Is the audience finding it useful? |
| Influence | Meetings, opportunities, hires, partner activity | Is it changing business behavior? |
Build a monthly team scorecard
Use a small set of stable measures. Report the median as well as total where a few high-reach executives could distort the picture. Segment by role or cohort because sellers, executives, and technical experts have different jobs.
- Active participant rate
- Relevant audience share
- Substantive interactions
- Business conversations
- Opportunities influenced
- Top friction observed
Add two examples each month: one interaction that shows quality and one lesson that changes next month’s plan. Numbers tell leadership what happened; examples explain why it matters.
Interpret post performance responsibly
Compare similar topics, authors, and formats over a series. A single post is noisy. Review opening clarity, member reach, audience roles, engagement quality, and follow-on profile or conversation signals. LinkedIn’s post analytics documentation explains current post-level measures.
A post with smaller reach among the exact buying group can be more valuable than a broad post that attracts peers. Set thresholds based on your audience size and baseline, not universal internet benchmarks.
Close the measurement loop
Use the scorecard to change behavior. If activity is low, address adoption. If reach is low but relevance and engagement are high, strengthen network and distribution. If reach is high but audience quality is low, change targeting and topics. If engagement is strong without conversations, improve the profile and next-step path.
Record LinkedIn-influenced outcomes in CRM or a shared log with evidence and attribution language. For the complete business case, read how to measure employee advocacy ROI.
Create a metric dictionary first
Define impressions, members reached, audience fit, substantive engagement, profile activity, conversation, meeting influenced, and opportunity influenced. Record the platform source, calculation, owner, frequency, and limitation for each measure.
LinkedIn’s current post analytics documentation says impressions are the number of times a post was shown, while members reached estimates distinct members and Pages. It also notes that analytics are estimates. The dashboard should preserve those definitions.
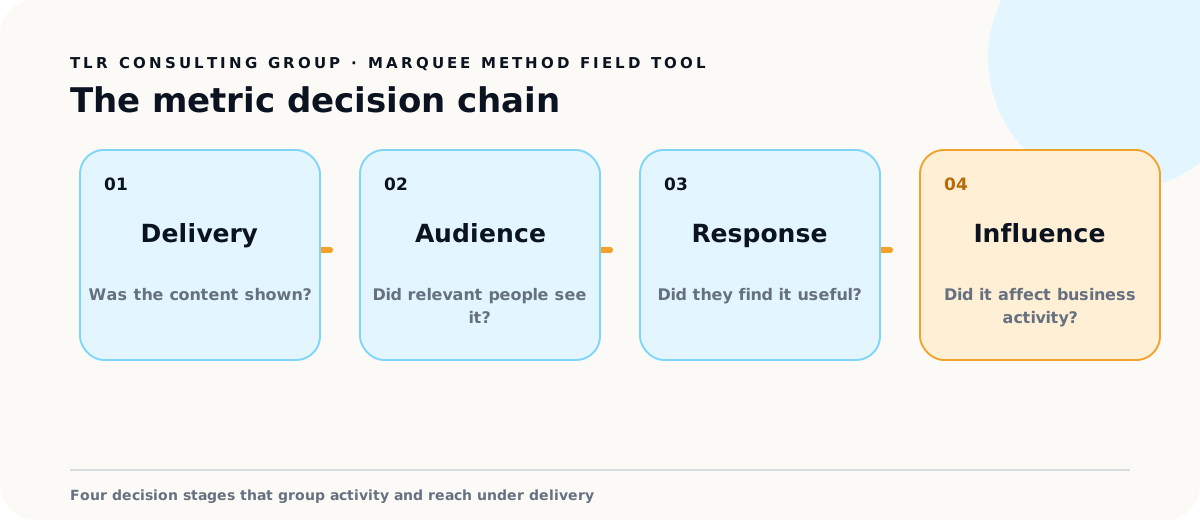
Match measures to the question
| Business question | Useful measures | Do not conclude |
|---|---|---|
| Are we reaching buyers? | Role, industry, company demographics | Every impression is relevant |
| Is the content useful? | Saves, sends, substantive comments | Every reaction signals intent |
| Are people becoming known? | Profile viewers, followers, inbound connections | Visibility equals trust |
| Does it affect business? | Documented conversations and CRM influence | Platform engagement caused revenue |
Build a monthly decision review
Spend the review on decisions, not a tour of charts. Name what changed, what likely explains it, what remains uncertain, and which test will run next. Segment by author, audience, topic, format, and editorial job only when the sample is large enough to support a useful comparison.
Use qualitative evidence alongside counts. Save representative comments, buyer questions, internal shares, direct replies, and sales notes. These records explain why the number moved and help the team improve the work.
Keep platform and business data connected
LinkedIn’s member analytics overview lists post, creator, audience, and profile analytics available to members. LinkedIn’s 2026 Employee Advocacy Analytics Guide adds program-level adoption and education. CRM notes and buyer feedback complete the picture.
Use stable campaign and account identifiers where privacy and policy allow. Report sourced, influenced, and correlated outcomes separately. Review data availability because LinkedIn features, retention periods, and account access can change.
Use a dashboard decision log
Every monthly report should end with a short log: observation, interpretation, uncertainty, decision, owner, and review date. Example: “Operations leaders represent a smaller share of reach for technical experts. We believe topic breadth is attracting peers. Next month, three posts will address plant-level decisions. Marketing owns the test; review on September 5.”
This log keeps the dashboard from becoming a presentation artifact. It also creates a record of what the team believed at the time, which makes later learning more honest.
At the next review, mark the decision confirmed, rejected, or unresolved. Preserve unresolved questions rather than forcing a conclusion from a small sample. Over several months, the log becomes an evidence-based operating history for the program.
Add a data-quality line to every decision. Note the number of posts or participants, missing audience information, unusual events, and any platform change that affects comparison. This keeps a clean chart from implying more certainty than the evidence supports.
Frequently asked questions
Which LinkedIn metric matters most for B2B?
No single metric. Audience relevance and meaningful business response are usually more decision-useful than raw impressions.
How can a company aggregate employee LinkedIn results?
Use a consent-aware monthly scorecard, employee-provided exports or snapshots where appropriate, and CRM evidence. Do not collect more personal data than necessary.
What is a substantive engagement?
A response that reveals relevance or intent, such as a detailed comment, save, direct question, repeated interaction, profile visit from a priority role, or business conversation.
Research and method: This guide separates documented platform features and cited research from the operating recommendations used in The Marquee Method. LinkedIn analytics are estimates, research findings describe their stated samples, and platform features can change. Review the linked primary sources before implementing account-specific workflows.
Put it into practice
Find the weak point in your visibility system.
The free Visibility Scorecard benchmarks your company against three competitors and identifies the clearest opportunity.
Request your scorecard